The average consumer attention is just 8 seconds, therefore the importance of getting seen is a very important quality online contents must possess. If any post, no matter how great the contents are or how stunning the writer was, if not positioned properly or lacking in the quality of getting seen, it cannot be heard, neither are you getting paid in any way, because let’s face it, the idea behind online contents is to convert viewers to customers.
So let’s jump into it and look at one of the best ways to make your articles get seen, so you can get heard and get paid.
INFOGRAPHICS
Grammatically, info-graphics is just a combination of two words; information and graphics. So we can go ahead and say info-graphics are any form of visual representation of information. For those who have been around blogging and internet for a long time, this is not new, because in real sense, to have a successful online presence for a long time, info-graphics must have contributed to the success. A mistake commonly made, is that info-graphics means images or image description of information, but it is actually more than that. Info-graphics can take the form of a chart or data or words made to look like pictures. Below is an info-graphic example
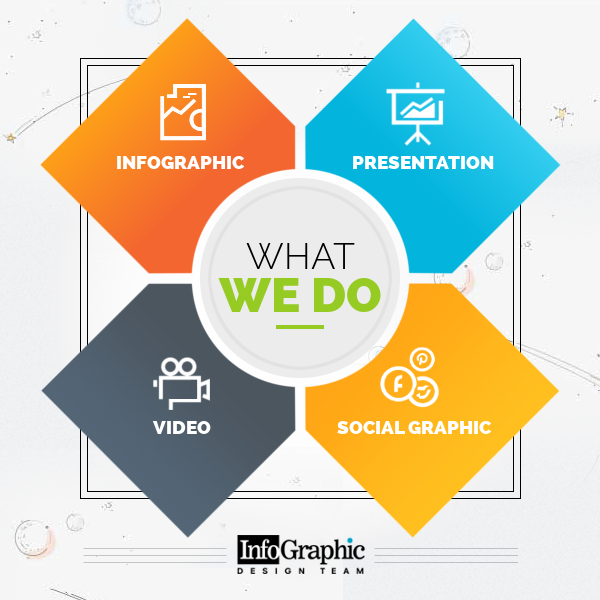
Sample 1 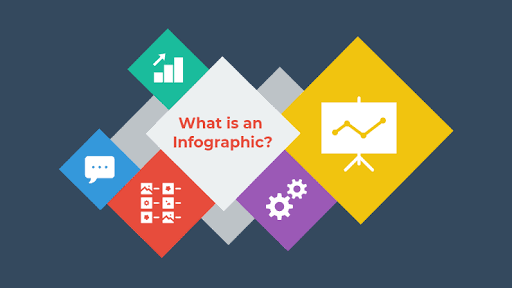
Sample 2
So why info-graphics? Well, you will agree with me that images or graphic explanation of an information often sticks longer than the information themselves and what is more? Attractiveness! This is the whole idea behind info-graphics. To attract internet users, what particularly attracts users could be the images used, the colour used, or the style and manner it was used, whichever case it is, info-graphics are one of the quickest ways to get seen easily, such that even after your viewer has left your page, he/she still retains a graphical memory of what information you were passing and can be easily traced for future access.
Info-graphics also goes as far as summarizing your contents and making it appear brief and simple to relate with, rather than a compounded write-up.
CREATING INFOGRAPHICS
In creating infographics, here are some key things to keep in mind:
- Your Audience: As beautiful as your designs are, with the wrong audience, your efforts would almost be useless. You need to first determine the audience your infographics design intends to capture. Is it business people? Online readers? Job seekers? Nursing mothers? Parents? Whoever your audience, one thing to keep in mind is that, there is always something that piques their interest, for example, nursing or expecting mothers would always be attracted to baby pictures, get the drift?
- Content and Organization: Like a bad meal with good aroma, if your designs are good and your content is poor, nobody would take a second look at it, so you need to get really good content for your design, and also organize it properly, what should come first should not go in the middle, neither is what is supposed to be below, go on top. Certain words should always stand out in your infographics, those are the key words and it varies depending on what your goal is.
- Template: creating an awesome infographics template is easier these, you can go online to pick already predesigned templates and work on it. We will deal more on this in the tools you can use to create your infographics.
Just keep in mind that practice, research and looking at similar designs that others have done, will go a long way to hone your infographics taste and skill.
TOOLS TO CREATE INFOGRAPHICS
There are various online tools to come up with your own info-graphics and depending on what you want but simple tools to create your own images includes
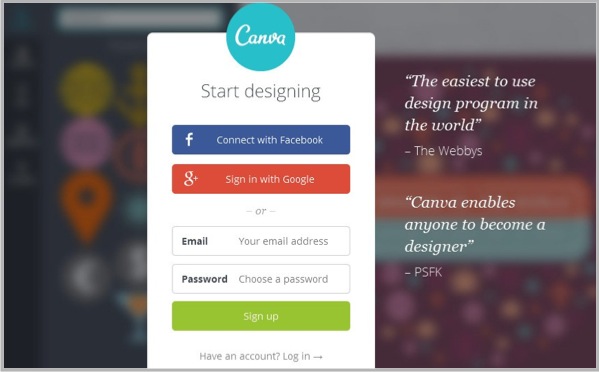
- Canva: Canva is one of the very simple online tools to create stunning info-graphic, it is simple to use and navigate, available on the internet and also has a phone app available on the google play-store. It also offers a few tutorial.
- easel.ly: This allows you to put together a stunning infographic image in just a few clicks. It comes with templates that you can edit to your taste.
- visualize.me: This tool lets you create infographic resumes, you sign in with your LinkedIn or email account, select your theme, and your design in whatever format you want.
- PiktoChart: piktochart is what most would refer to as a threat for graphic designers, it has over 400 fully customizable themes with ready-made images inclusive, all for you to adjust to your taste.
There are so many other tools to make infographics but these ones a good place for you to start off.
MAKING YOUR INFOGRAPHICS VIRAL
So, you have created that beautiful and stunning infographic, and the next stop is where to put it. One key place to share your infographic and make it seen is to place them on your social media handles, I mean why not, people spend a lot of time on these social channels almost more than anywhere else. So you will want to look at Facebook, Instagram and the likes.
Another place to share your infographics is by creating an SEO optimized post, this places your infographic strategically that google pops it up first when someone searches for such related posts.
You can also submit your infographics to directories, blogs and archive sites like Visual.ly, Daily Infographic, Cool infographics, Infographics archive and Flickr.
Until next time, remember if you are not being seen on the internet, you won’t be heard and you won’t get paid. So…… get seen!!!